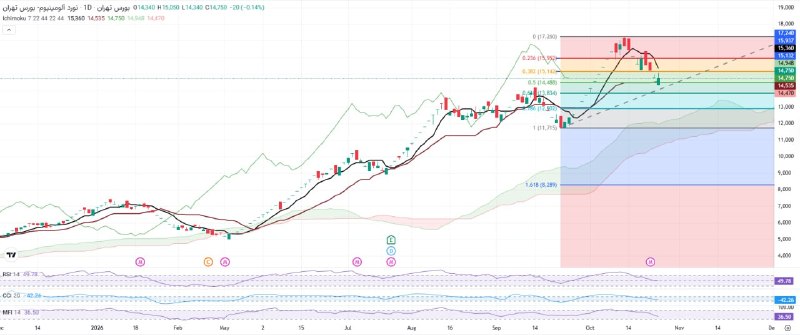
Technical analysis of two price scenarios before the stock after increasing from the range of 1172 tomans to 1726 tomans, the Panwal symbol entered the correction phase and the price retreated to the 50% Fibonacci level in the range of 1448 tomans. By registering a bullish candle on the last trading day, the possibility was raised that the trend would return to the upward track; However, the state of the indices still indicates continued downward pressure.
Technical analysis of two price scenarios before the stock after increasing from the range of 1172 tomans to 1726 tomans, the Panwal symbol entered the correction phase and the price retreated to the 50% Fibonacci level in the range of 1448 tomans. By registering a bullish candle on the last trading day, the possibility was raised that the trend would return to the upward track; However, the state of the indices still indicates continued downward pressure.
More on Radar
Want to see every report in real time?
Hundreds of sources worldwide, translated into your language, with alerts for what matters to you.
Sign up free Already have an account? Log in