Radar Telegram alerts Open Radar

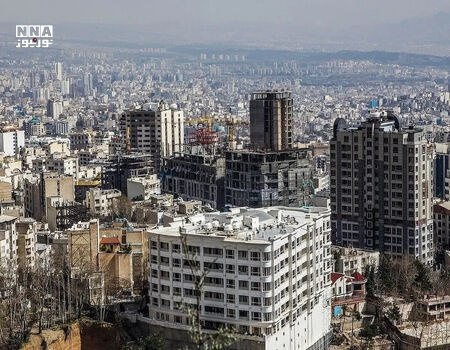
Housing price growth chart in 22 districts in Tehran; Which areas led?

תרגם לעברית

Nour News · · Source

🇮🇷 Iran · טהרן · Map

Housing price growth chart in 22 districts in Tehran; Which areas led?

Housing price growth chart in 22 districts in Tehran; Which areas led?

The statistics published on the increase in housing prices in 22 districts of Tehran during the last 12 months indicate a significant difference in price trends in the north, center and south of the capital; The areas at the top of this list are not necessarily the most expensive areas in the city.

Read the full text at the link below.

More on Radar

Want to see every report in real time?

Hundreds of sources worldwide, translated into your language, with alerts for what matters to you.

Sign up free
Share on WhatsApp Get alerts on Telegram